
ECG: what P, T, U waves, the QRS complex and the ST segment indicate
The electrocardiogram (sometimes abbreviated ECG) at rest and in its “under stress” variant, is a diagnostic examination that allows the graphic reproduction, on a monitor or on paper, of the heart’s electrical activity during its operation, which makes it possible to detect the possible presence of a heart disease or rhythm disturbance (arrhythmia)
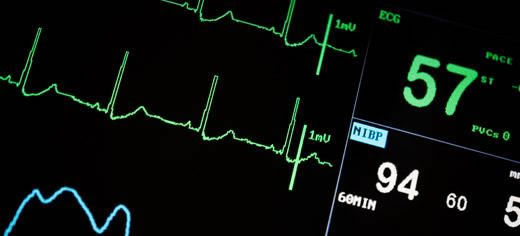
ECG, the electrocardiographic trace and its waves
The ECG tracing is characterised by several stretches called waves, positive and negative, which repeat with each cardiac cycle and indicate the specific activity of the heart related to the propagation of the cardiac electrical impulse.
The normal ECG tracing has a characteristic appearance that changes only in the presence of problems: a given pathology tends to result in a specific alteration at one or more points of the tracing, returning waves that are altered in height, shape or inverted.
IMPORTANT: For ECG interpretation to be reliable, the electrodes must be positioned correctly: an error in positioning can lead to false-positive results, i.e. result in altered waves indicating pathologies that are not really present.
P wave in an ECG
This is the first wave generated in the cycle, and corresponds to the depolarisation of the atria.
It is small, as the contraction of the atria is not as powerful. Its duration varies between 60 and 120 ms, and its amplitude (or height) is 2.5 mm or less.
QRS complex in an ECG
Corresponds to the depolarisation of the ventricles and is formed by a set of three waves that follow each other:
- Q wave: is negative and small, and corresponds to depolarisation of the interventricular septum;
- R wave: is a very high positive peak, and corresponds to depolarisation of the apex of the left ventricle;
- S wave: this is also a small negative wave, and corresponds to depolarisation of the basal and posterior regions of the left ventricle. The duration of the entire complex is between 60 and 90 ms. Atrial repolarisation also occurs in this interval, but is not visible as it is masked by ventricular depolarisation.
T wave
Repolarisation of the ventricles. It is not always identifiable because it can also be very small in value.
U wave
This is a wave that cannot always be appreciated in a trace, due to the repolarisation of the papillary muscles.
QUALITY DAE? VISIT THE ZOLL BOOTH AT EMERGENCY EXPO
ST tract (or segment)
This represents the period when the ventricular cells are all depolarised and therefore no electrical movements are detectable.
Hence it is usually isoelectric, i.e. placed on the baseline of the tracing, from which it can move up or down by no more than 1 mm.
The ischaemia that occurs during a myocardial infarction typically produces an ST-segment over- or under-elevation, depending on whether the lesion is intramural, i.e. involving only the inner portion of the myocardium, or transmural, i.e. crossing the entire thickness of the myocardium.
Ischaemia may sometimes not be associated with an immediate ST segment change in the first few hours after symptomatic onset, so the diagnostic element must always be interpreted by specialists and supplemented by the enzyme assay.
ST over- or under-elevation is often associated with T-wave inversion, which represents the ‘electrical memory’ of recent ischaemia.
QT interval

Represents electrical systole, i.e. the time in which ventricular depolarisation and repolarisation occurs.
Its duration varies as the heart rate varies, generally staying between 350 and 440ms.
RR interval and heart rate
The ECG trace is compiled on graph paper, which runs through the electrocardiograph at a rate of 25 mm per second, so five sides of 5 mm squares represent 1 second.
It is therefore easy to imagine how heart rate can immediately be obtained by estimating how much time passes between one cycle and the next (the time between two R peaks is measured, called the RR interval).
Just as an example, if we have a complex every 4 squares of 5 millimetres, this means that our frequency is around 75 beats per minute.
That is, since each 5 mm square corresponds to 0.2 s and, therefore, 4 squares to 0.8 s, we need only divide 60 s (1 minute) by 0.8 s to obtain the frequency of 75 beats per minute.
Or, more simply, we can divide 300 by the number of 5 mm squares between two adjacent R-peaks.
In the case of an irregular rhythm, the distance will be the average between 3 adjacent RR distances.
Read Also:
Emergency Live Even More…Live: Download The New Free App Of Your Newspaper For IOS And Android
What Is An ECG And When To Do An Electrocardiogram
ST-Elevation Myocardial Infarction: What Is A STEMI?
ECG First Principles From Handwritten Tutorial Video
ECG Criteria, 3 Simple Rules From Ken Grauer – ECG Recognize VT
Defibrillator: What It Is, How It Works, Price, Voltage, Manual And External
First Aid: What To Do After Swallowing Or Spilling Bleach On Your Skin
Signs And Symptoms Of Shock: How And When To Intervene
Proper Defibrillator Maintenance To Ensure Maximum Efficiency
Electrical Injuries: How To Assess Them, What To Do
Study In European Heart Journal: Drones Faster Than Ambulances At Delivering Defibrillators
Cardiac Massage: How Many Compressions Per Minute?