
ECG: waveform analysis in the electrocardiogram
EKG/ECG waveforms have different distinguishing characteristics and can be classified as either isoelectric, positive, or negative
Isoelectric waveforms show no deflection and are neither positive nor negative, thus it appears as an EKG/ECG that is non-existent or “at rest”
Positive waveforms are any waveform above the isoelectric line.
Negative waveforms are any waveforms below the isoelectric line.
Electrical signals that can be tracked during an electrocardiogram:
- Originate in the pacemaker cells of the sinoatrial (SA) node →
- spread through the atria, then →
- inferiorly through the atrioventricular (AV) node →
- down into the bundle of His → into the Purkinje fibers, and finally →
- down and to the left throughout the ventricles.
These electrical signals can be captured and imaged by placing a number of electrodes on the skin of a patient in predetermined positions, and then a waveform pattern of voltage graphed over time can be interpreted to determine many cardiac diseases or to gauge function.
To begin, measurements of intervals between particular portions of the measured electrical activity can indicate normal or abnormal conduction within the heart and measurements of segments can indicate tissue ischemia or infarction, and necrosis.
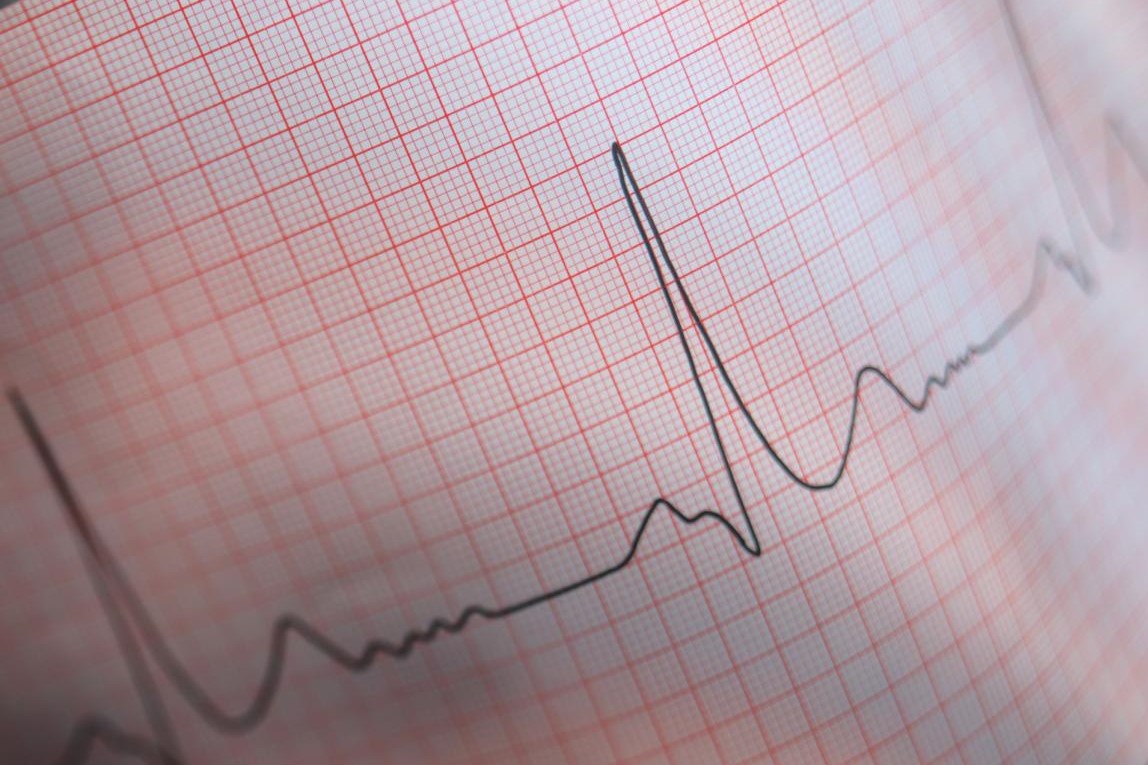
The ECG Grid
The actual recording of an EKG can determine:
- Rate
- Rhythm
- Intervals
- P wave
- QRS complex
- ST-T waves (isoelectric, elevated, or depressed relative to the TP segment)
- Axis
Overall interpretation, that is, the diagnosis.
In the field, know that you’re going to be limited to determining rate, rhythm, and identifying the waves and complexes without a 12-Lead ECG.
Although you may be able to identify arrhythmias, blocks, or hyperkalemia, interpretations that are diagnoses of ischemia are determined by 12-lead ECG or at the appropriate facility of transport.
ECG: MEASURING WAVEFORM AMPLITUDE (Height)
Height on the Y-axis–Amplitude of an EKG/ECG measures voltage during the cardiac cycle and is measured by the Y-axis on the standard EKG/ECG paper.
1 mm = 0.1 mV; 5-mm box = 0.5 mV
Each 1-mm box on standard paper represents 0.1 millivolts of electricity. Five 1-mm boxes make a larger box and represent 0.5 millivolts.
MEASURING RATE (Length)
Length on the X-axis: Rate measurements of an EKG/ECG use the durations, waveforms, segments, complexes, and intervals of specific parts of the cardiac cycle.
1 mm = 0.04 seconds; 5-mm box = 0.2 seconds.
Each 1-mm box on standard paper represents 0.04 seconds. Five 1-mm boxes make a larger box and represent 0.2 seconds.
The ECG/EKG strip method is performed by printing a six-second strip of a current heart rhythm.
The standard EKG/ECG paper has marks at the top and bottom indicating every six seconds.
Multiply the number of beats in the six-second strip by ten to get the estimated number of beats per minute.
The “300”/triplicate method is used by counting from the QRS complex that falls on a thick vertical line on the EKG/ECG paper.
From the complex centered on that vertical line, a QRS on the next thick vertical line represents 300 beats/min, or on the following one represents 150 beats/min, or on the following one represents 100 beats/min, the next one 75 beats/min, and the next one 60 beats/minute.
Wherever the next QRS falls, the rate can be estimated using these predefined vertical lines. If the cardiac rate being assessed does not have a QRS complex within five vertical lines to the right of the initial QRS complex, the rate is less than 60 beats/min.
The division of 300 by the number of large boxes calculates the heart rate.
If the interval between two successive complexes is one large box, then the rate is 300 ÷ 1 = 300 beats/min.
If the interval is two large boxes, the rate is 300 ÷ 2 = 150 beats/min.
This calculation may be carried on down the line for each additional large box, to 100 beats/min, 75 beats/min, 60 beats/min, 50 beats/min, etc.
Remember, 300-150-100-75-60.
Alternate Method: simply measure the interval BETWEEN 2 QRS complexes and divide the number 60 by that number.
Example: if the time between two QRS complexes is 0.75 seconds (1-mm boxes = 0.04 seconds; 5 1-mm boxes = 0.2 seconds), then
60 seconds/minute ÷ 0.75 seconds/beat = 80 beats/min.
Alternate Method: If the rhythm is irregular, count the number of QRS’s per standard 10-second EKG interval and multiply by 6.
MEASURING AXIS (Direction/Magnitude) in a ECG
The heart’s electrical signal contains information relative to direction and magnitude of the various complexes.
The average direction of any of the complexes can be determined.

The QRS axis moves leftward throughout childhood and adolescence.
An easy way to determine the axis, which can indicate cardiac disease, is to find the lead that has the most isoelectric QRS, and the axis can be assumed to be perpendicular to that lead. Typically, the normal axis will reflect positive in leads I and aVF.
For example, right deviation of the axis can occur from right ventricular hypertrophy. Left axis deviation can result from left ventricular hypertrophy.
Artifact: false electrical current on an EKG or ECG that is often generated whenever movement occurs by the patient, when someone else touches the patient undergoing the ECG, or whenever rough terrain is encountered during transport.
Axis Deviation
Determining axis determination is done through one of three ways:
The Quadrant Method – (Lead I and aVF)
Lead I/aVF Axis Deviation Algorithm:
+/+ = Normal.
-/+ = Right axis.
+/- = Left axis.
-/- = ERAD. (Extreme RAD)
Three Lead analysis – (Lead I, Lead II and aVF)
Isoelectric Lead analysis (the easiest way: find the lead that has the most isoelectric QRS, and the axis can be assumed to be perpendicular to that lead.
NORMAL AXIS
Lead I – Upright QRS
Lead II – Upright QRS
Lead III – Upright QRS
LEFT AXIS DEVIATION
QRS is upright in lead I (positive) and
downward in lead aVF (negative).
RIGHT AXIS DEVIATION
QRS is predominantly negative in lead I and
positive in lead aVF.
Read Also:
Emergency Live Even More…Live: Download The New Free App Of Your Newspaper For IOS And Android
Heart Disease: What Is Cardiomyopathy?
Inflammations Of The Heart: Myocarditis, Infective Endocarditis And Pericarditis
Heart Murmurs: What It Is And When To Be Concerned
Broken Heart Syndrome Is On The Rise: We Know Takotsubo Cardiomyopathy
What Is A Cardioverter? Implantable Defibrillator Overview
‘D’ For Deads, ‘C’ For Cardioversion! – Defibrillation And Fibrillation In Paediatric Patients
Inflammations Of The Heart: What Are The Causes Of Pericarditis?
Do You Have Episodes Of Sudden Tachycardia? You May Suffer From Wolff-Parkinson-White Syndrome (WPW)
Knowing Thrombosis To Intervene On The Blood Clot
Patient Procedures: What Is External Electrical Cardioversion?
Increasing The Workforce Of EMS, Training Laypeople In Using AED
Difference Between Spontaneous, Electrical And Pharmacological Cardioversion
What Is Takotsubo Cardiomyopathy (Broken Heart Syndrome)?
The Patient’s ECG: How To Read An Electrocardiogram In A Simple Way